In this project, I created a model that detects hate speech in Arabic using machine learning algorithms,
and I was able to get an accuracy of 92% after doing many experiments.

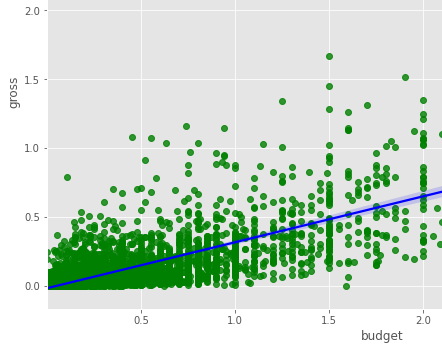
In this project I will find the correlation that makes the movie profitable using movie data
by cleaning the data and then comparing the variables and creating graphs that show the relationships between the variables
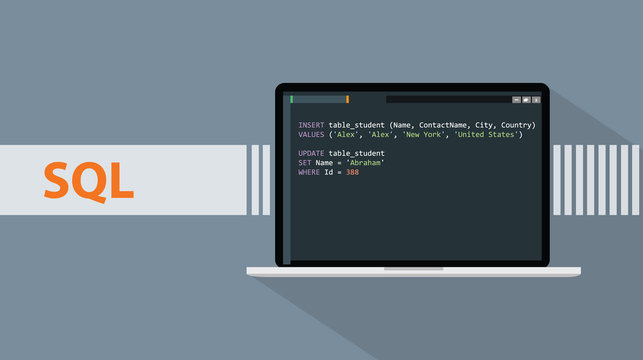
In this project, I will clean the housing data by correcting the wrong values,
filling in the blank values if possible or deleting them and preparing the data for analysis and extraction of insights
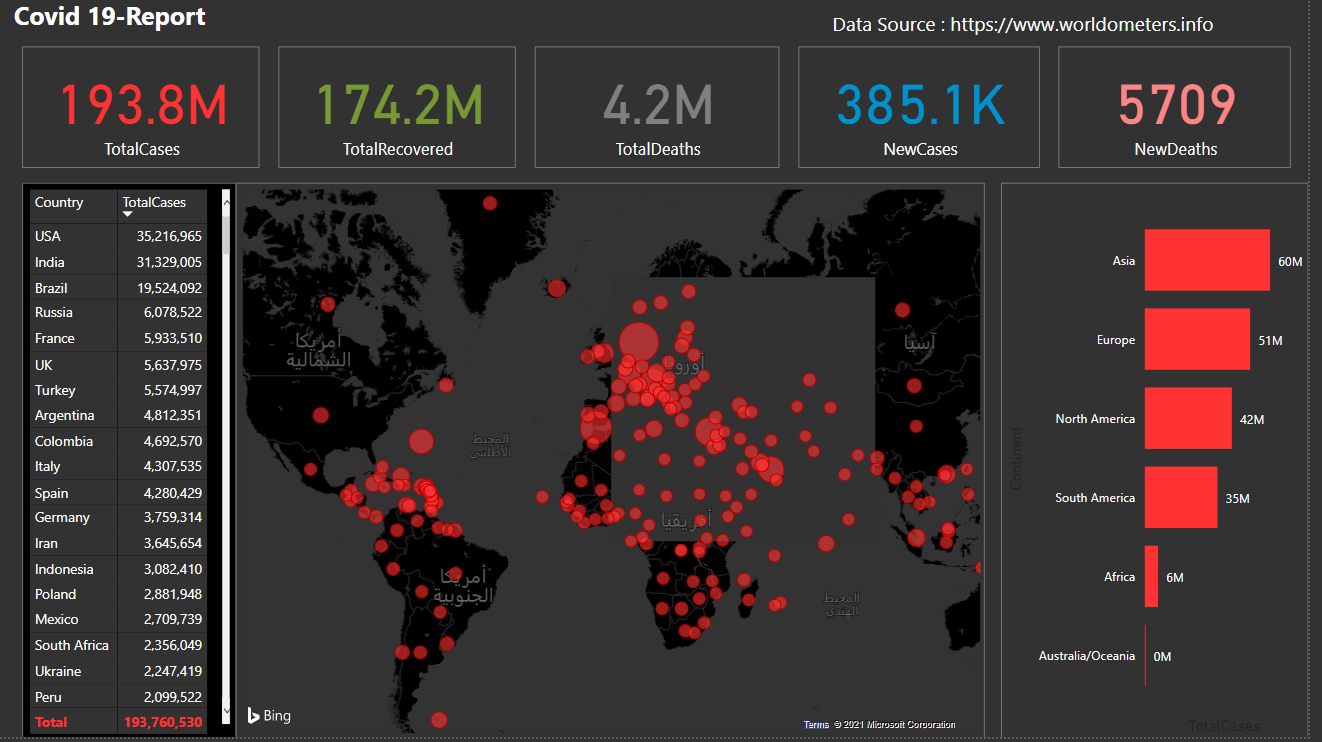
This Dashboard Power BI displays the total of Corona cases, the total deaths, the total new cases,
and the total recovered cases based on the data it takes from worldometers website, and it can determine the continent and country in order to obtain certain data
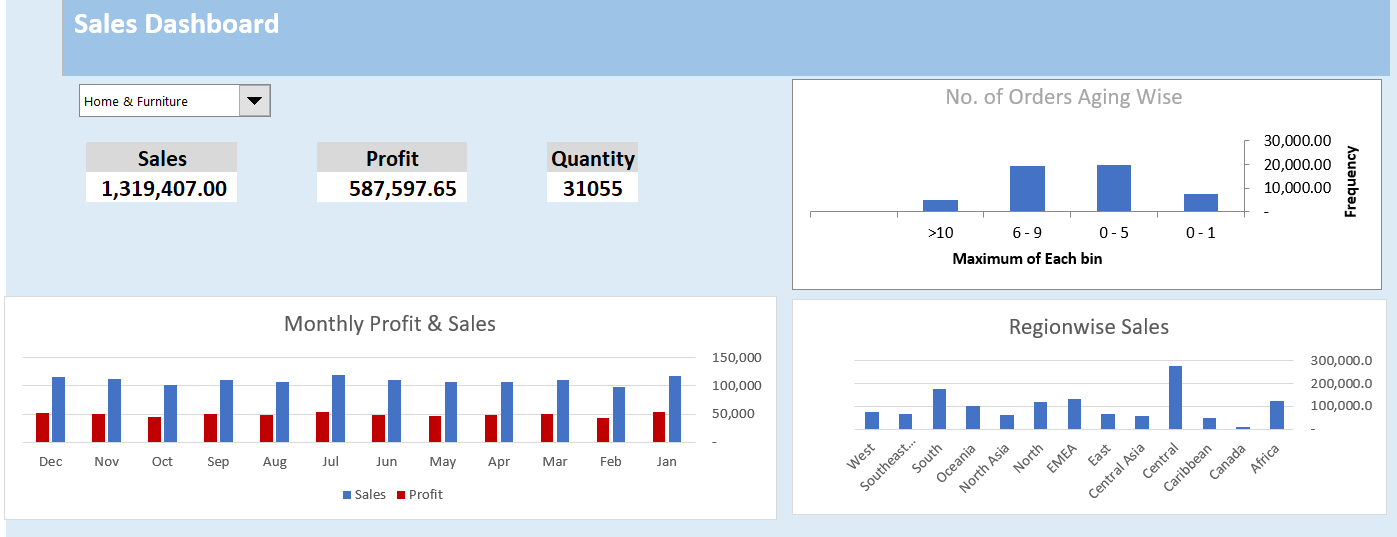
This is an Excel Dashboard that shows sales and profits by month and region.
The data can be determined by selecting the department
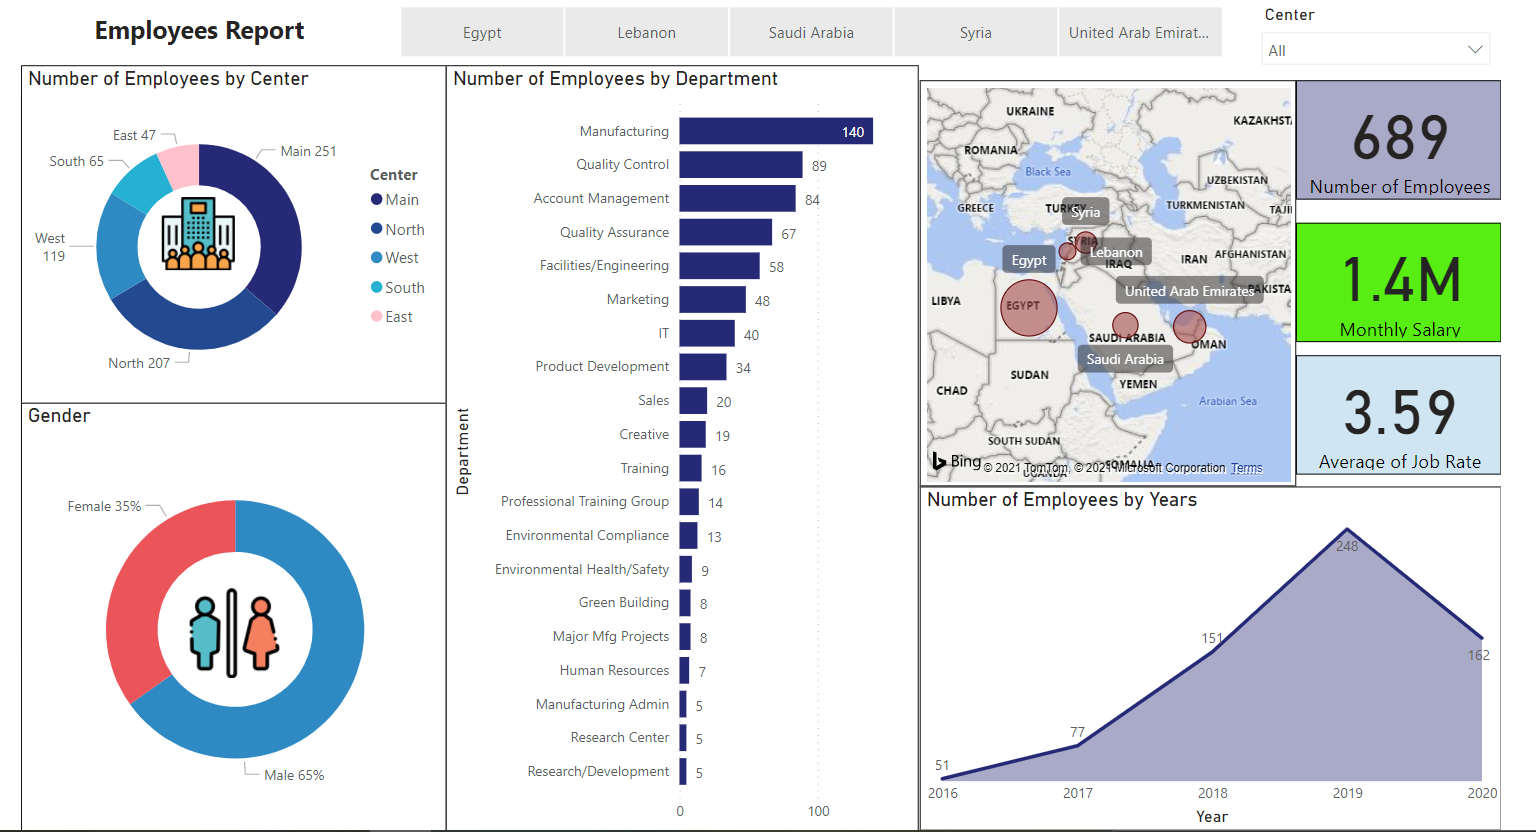
This is a Power PI report showing the number of employees in each department, the number of employees in each year, the average monthly salaries of employees and more.
The results of the report can be categorized by country
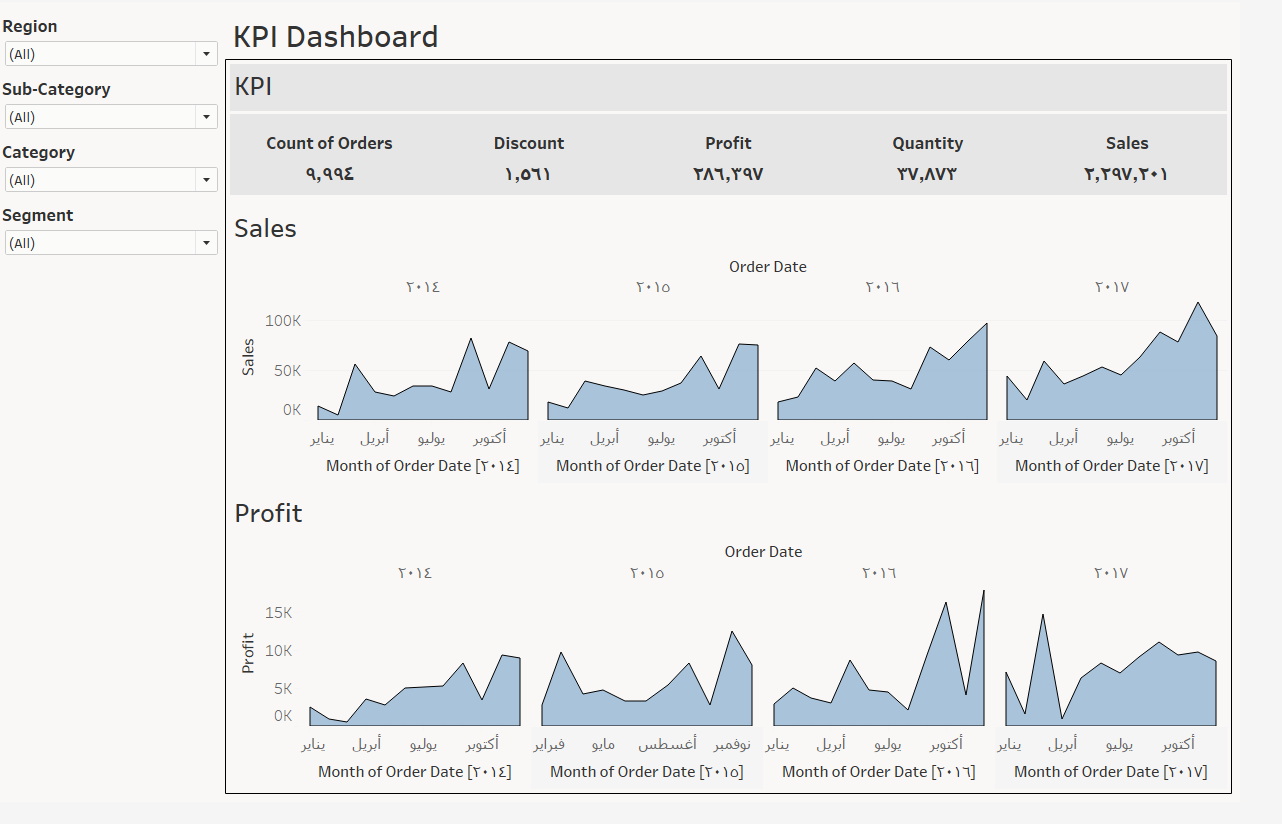
This Dashboard dashboard shows key performance indicators such as profits, sales, number of orders and discounts,
and the data can be specified by department, region, department and product type

This is a project to analyze Arabic texts and detect hate speech in them through the use of
texts classified into positive and negative using and using machine learning algorithms


